
Quarterly Annuity Update
Q2 2026: Strong Market Performance Supports Pension Funding and Risk Transfer Activity
As of June 30, 2026, our Pension Risk Transfer team completed 40 annuity placements totaling $567 million and covering approximately 7,600 plan participants.
Transaction activity reflects continued demand for both targeted and comprehensive risk transfer solutions. Of the placements completed this year, 42% supported ongoing pension de-risking strategies while 58% facilitated full plan terminations, demonstrating our ability to guide plan sponsors through a wide range of annuity transactions.
Client outcomes remain strong. Average annuity placement savings reached 3.8% through the first half of 2026, reflecting the value of competitive insurer bidding, disciplined transaction management and deep relationships across the insurance marketplace.
Pension risk transfer activity continues to benefit from favorable funded positions, sustained plan sponsor interest and growing insurer capacity. As insurers expand underwriting flexibility and administrative capabilities, additional opportunities are emerging for plans with complex benefit structures and specialized participant populations.
USI's retirement consulting professionals continue to help organizations evaluate annuity placement opportunities, improve cost efficiency and execute pension risk transfer strategies with confidence.
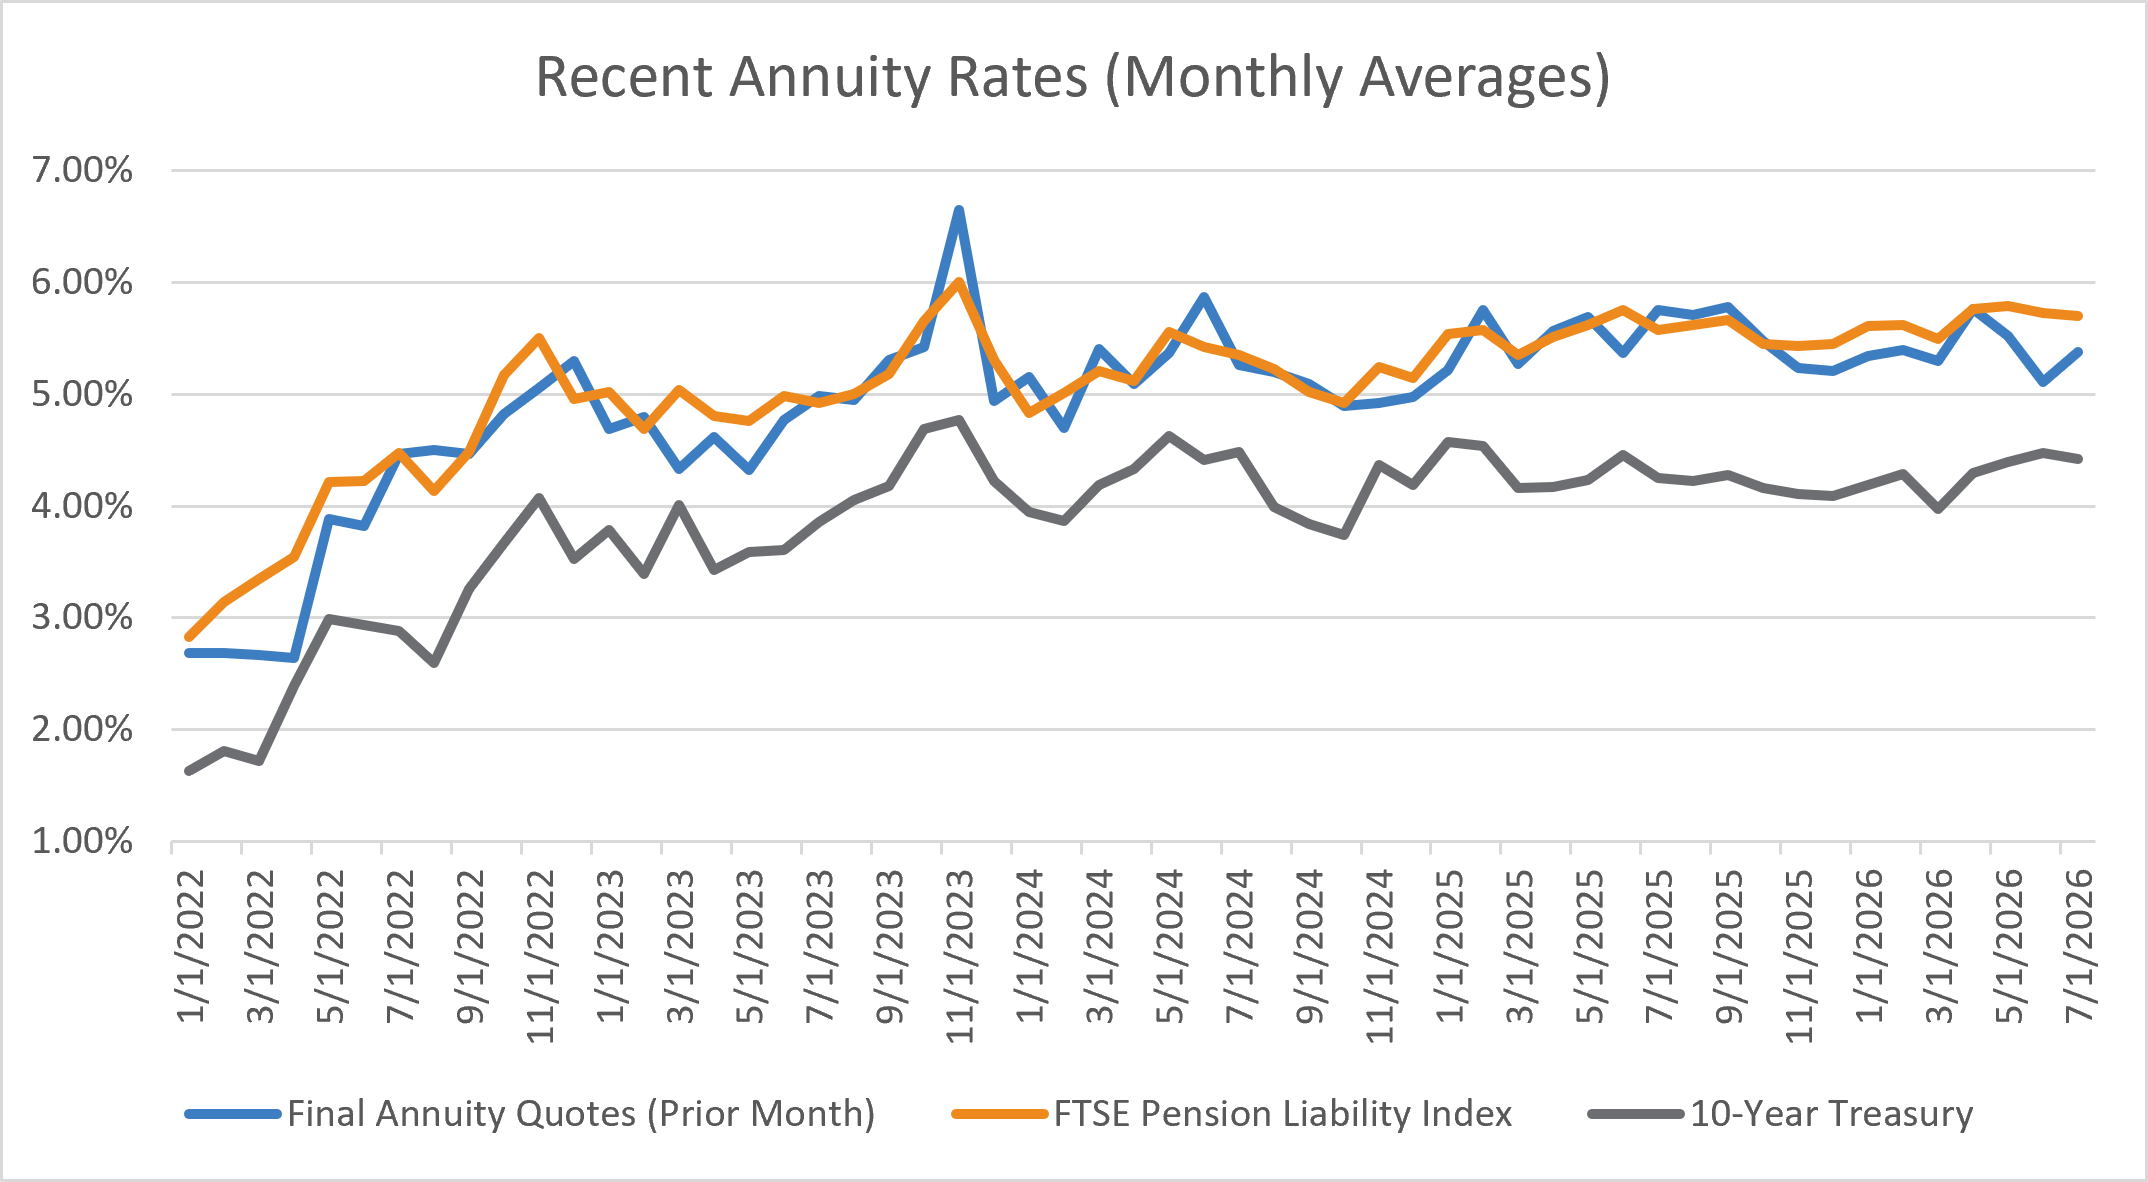
Sources: FTSE Pension Liability Index Report. Data as of June 30, 2026.
Pension Plan Landscape & Industry Trends — Pension Risk Transfer
Pension risk transfer strategies help plan sponsors reduce financial exposure by shifting pension liabilities to an insurance company. A buy-out is a standard contract in the industry, transferring assets and liability from the plan sponsor to insurance company. A buy-in locks in future buy-out pricing with no accounting settlement. The assets and liabilities are maintained within the plan and held in a contract with the insurance company.
U.S. Pension Risk Transfer Rebounds From Q1 2026
Strong 2025 Close Accelerated Sales Anticipated for Q1 2026.
| $3.8 Billion in U.S. Pension Risk Transfer Sales for Q1 2026 | Q1 2026 Sales Were $768 Million, an Increase of 443% from Q1 2025 |
|
|
Sources: LIMRA Group Annuity Risk Transfer Sales Survey.
Observations from USI’s Retirement Annuity Placement Practice

Sales Activity is High in Q2 and into Q3
Interest Rates Remain High Creating Favorable Pricing
Carriers Are Expanding Their Underwriting Constraints
- Carriers have participated in quotes below their standard minimum premium, or are willing to offer separate account at lower levels
- Carriers are continuing to expand their administration capabilities. Where some were unable to write more complex features, they are now able (cost of living, pop-up benefits, employee contributions)
Pension Plan Landscape & Industry Trends — Returns
EQUITIES ROSE IN Q2 2026 |
INTEREST RATES RISING IN Q2 2026 |
|
|
PENSION PLAN FUNDED STATUS IMPROVED IN Q2 2026 |
CREDIT SPREADS HAVE NARROWED |
|
|
Market Summary for Pension Plans
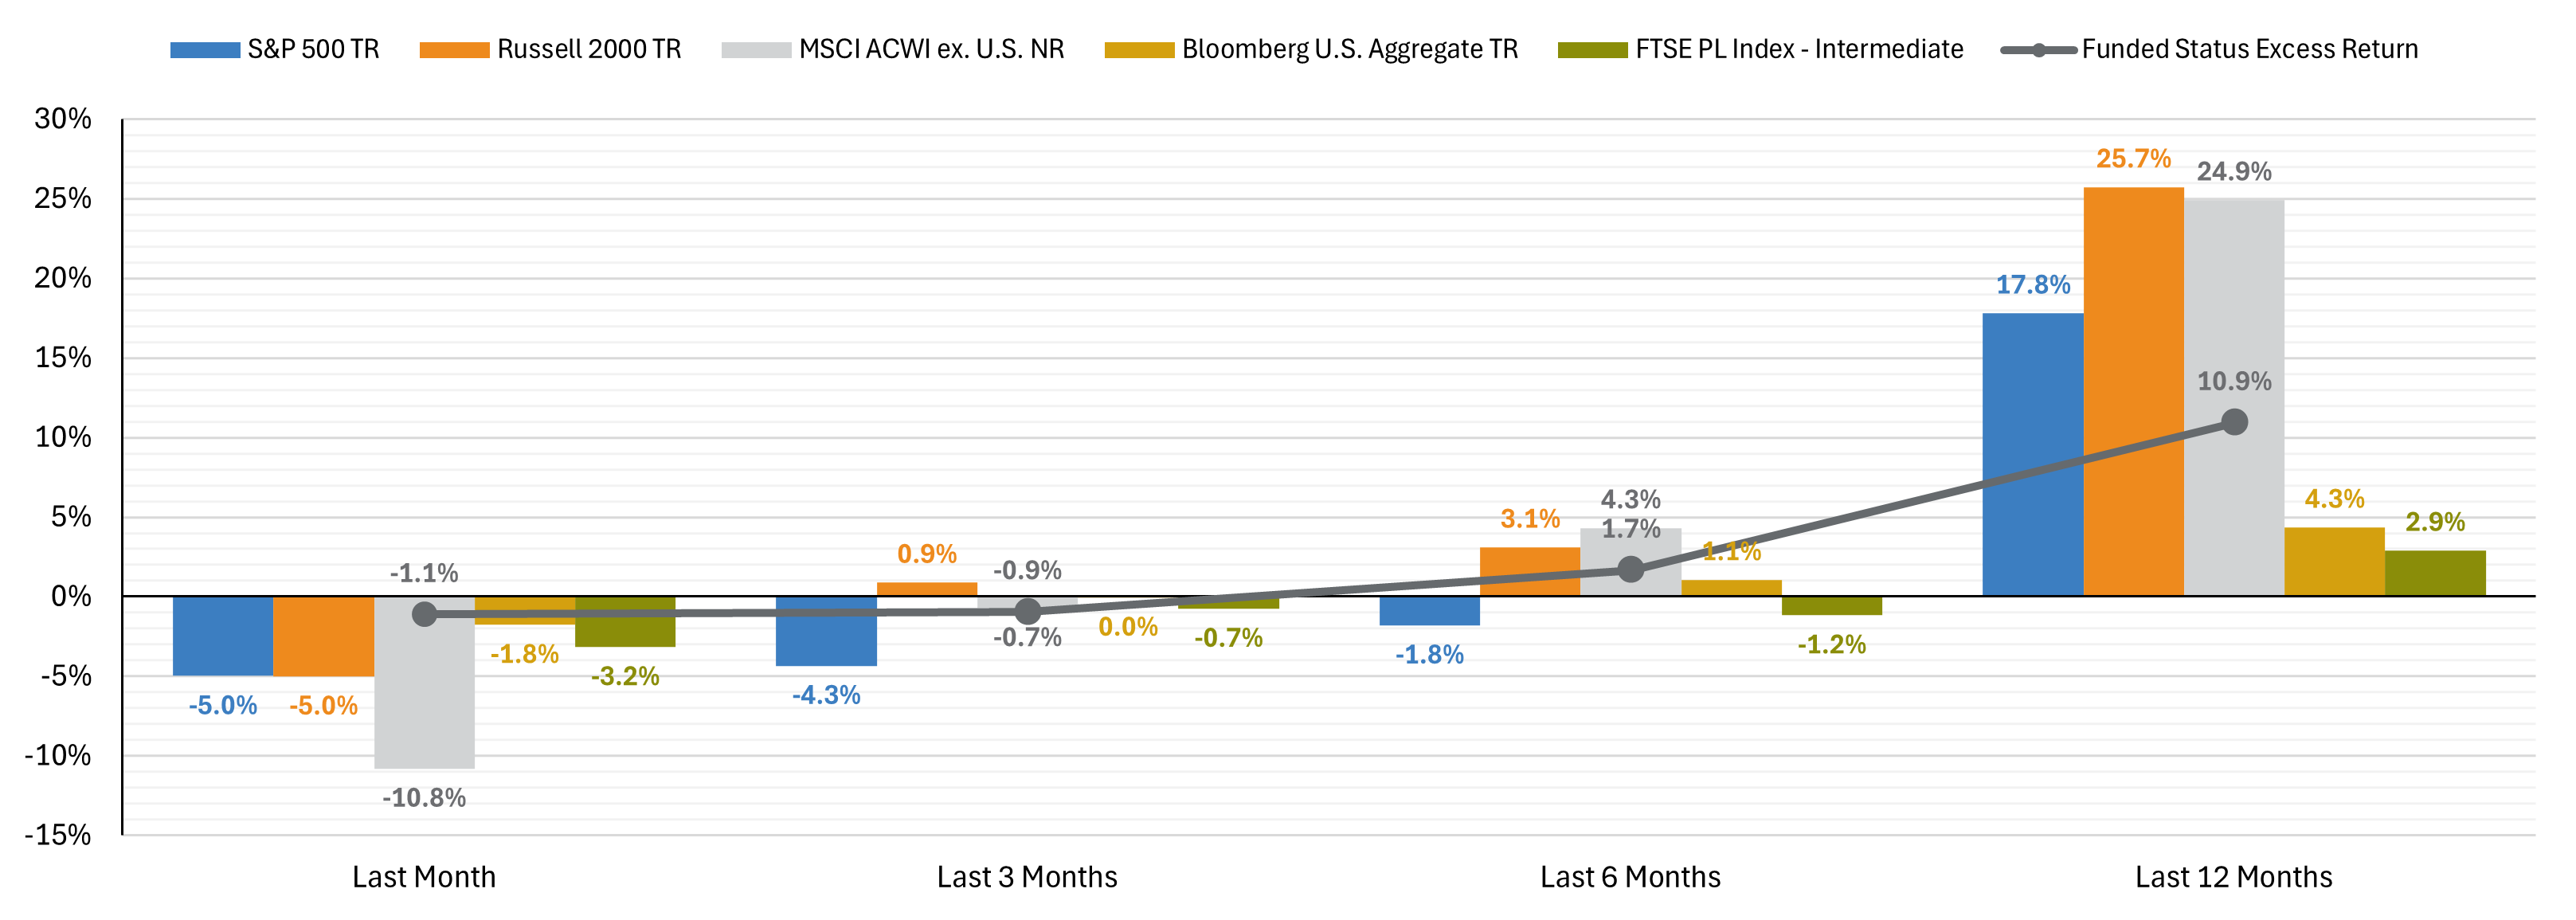
Sources: Morningstar, U.S. Treasury, FTSE Pension Liability Index Report. Data as of June 30, 2026.
Pension Plan Landscape & Industry Trends — Monitoring
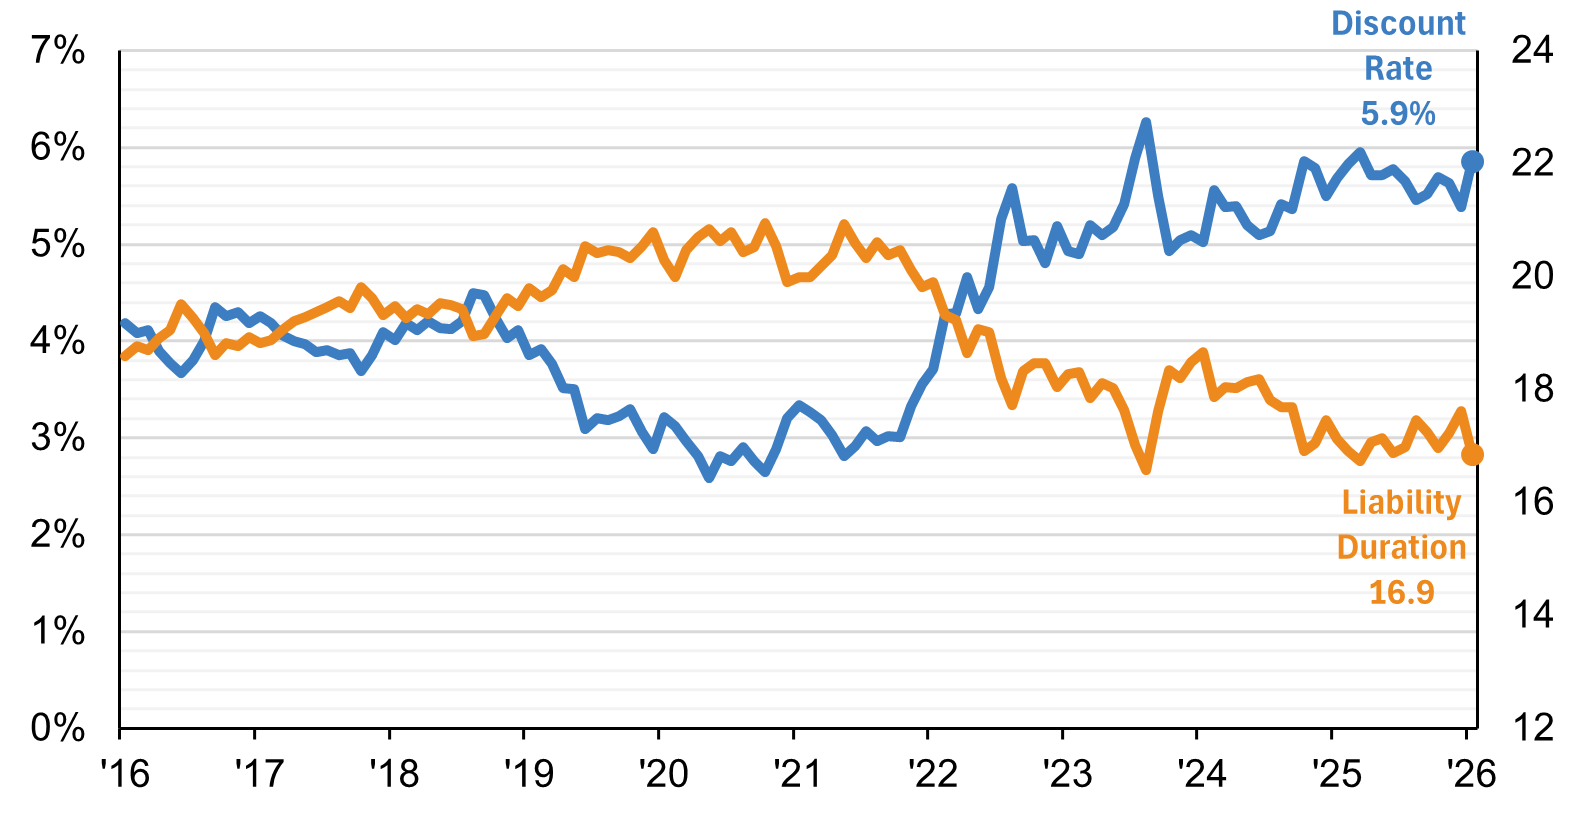
PENSION LIABILITY INDICES |
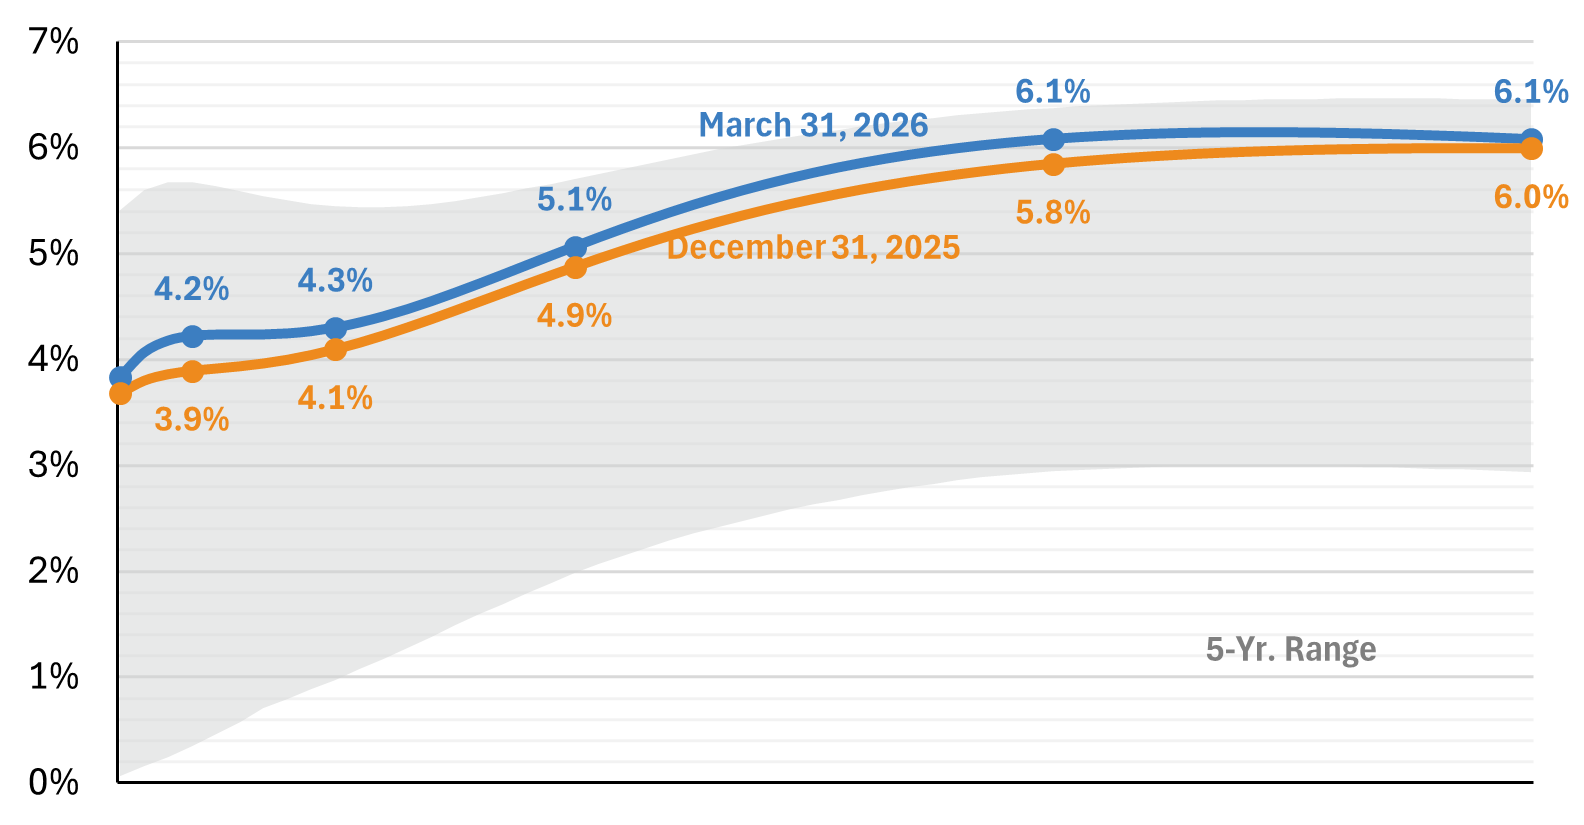
PENSION LIABILITY CURVE |
|
This chart tracks the Discount Rate and Liability Duration from 2016 through 2025. It highlights how interest rate changes and liability durations impact pension obligations over time. A rising discount rate typically reduces liabilities, while longer durations indicate greater sensitivity to rate changes which are key metrics for monitoring plan health. |
This curve compares pension liabilities across different maturities (6 months to 30 years) at two points in time. It shows how liabilities shift with changes in the yield curve, helping plan sponsors understand the timing and magnitude of future obligations. |
INDEX MODEL LIABILITIES |
FUNDED STATUS SENSITIVITY |
|
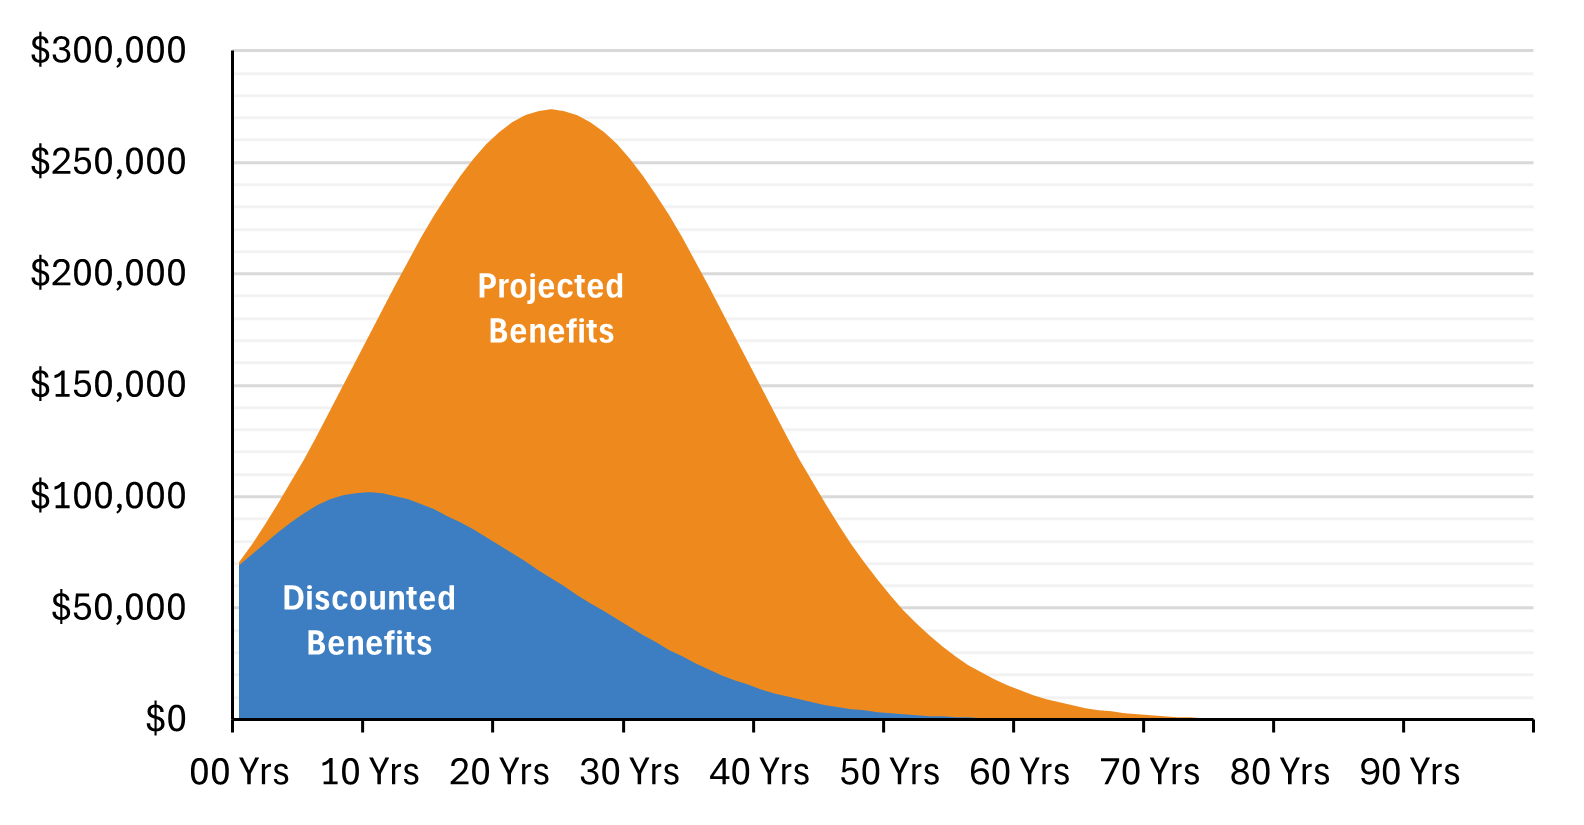
This chart contrasts projected benefit payments with their present value across a 90-year horizon. It visualizes the long-term financial commitment of pension plans and the impact of discounting future benefits essential for evaluating funding strategies and sustainability. |
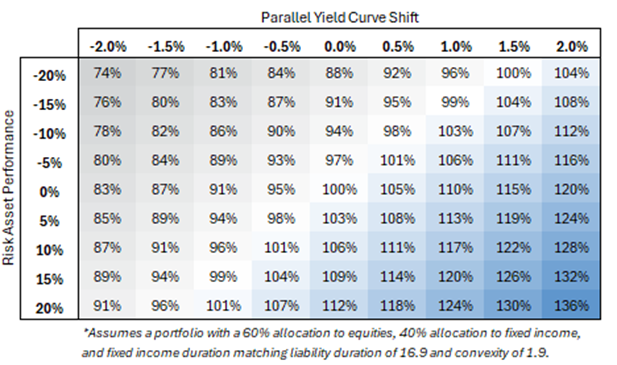
This chart helps plan sponsors understand how interest rate changes affect liabilities and funding levels which is critical for risk management and strategic planning. It shows how a pension plan’s funded status reacts to shifts in the yield curve, ranging from -2.0% to +2.0%. Each row represents a starting funded status (from 70% to 120%), and each column reflects the impact of interest rate changes. Blue cells indicate improved funding (typically from rising rates), while gray cells show deterioration (from falling rates). For example, a plan that is funded at 100% today could decline to 74% funded with a -2.0% decrease or rise to 137% with a +2.0% increase in interest rates.
|
Sources: USI Consulting Group. Data as of June 30, 2026.

STRATEGY BEFORE PLAN TERMINATION:
Surplus Management, De-Risking and the Role of Group Annuities
We hosted an informative webinar offering practical insights into the pension plan landscape and plan termination strategies.
If you couldn't attend, watch the on-demand webinar to learn about the strategy of de-risking, annuity placement and surplus management—and how these approaches impact the plan termination process.
How USI Can Help
Our retirement consulting ream is pleased to offer the opportunity to purchase single premium annuity contracts through a menu of quality insurance carriers. Our actuaries and annuity product consultants are trained to assist clients on the merits and/or limitations of a single premium annuity purchase for their specific cases. Our proactive consulting by an integrated team can provide savings that exceed an individual de-risking strategy.
To learn how we can help you, please contact your USI retirement consultant, visit our Contact Us page or email us at information@usicg.com.

Investment advice provided to the Plan by USI Advisors, Inc. Under certain arrangements, securities offered to the Plan through USI Securities, Inc. Member FINRA/SIPC. Both USI Advisors, Inc. and USI Securities, Inc. are affiliates of USI Consulting Group. | 2126.S0729.99025
Not receiving our newsletter?
Stay up to date with retirement plan updates and insights by subscribing to our email list.